Goal! Detecting the most important World Cup moments
7 min
This article was originally published in Twitter Developer Blog during my time there as Developer Advocate.
Billions of fans around the world are tuned in to the World Cup matches, and many use Twitter to support their teams and join in the global public conversation about the games.
At the end of May, we held a World Cup-themed hackathon in São Paulo, Brazil. Between helping to organize the event and mentoring some of the teams, I played a little bit with Raspberry Pi and the Twitter Streaming API. My idea was to build a goal bell that would ring when the volume of Tweets around a specific goal grew very quickly. In order to do this, I had to connect to the Streaming API so as to calculate the frequency of Tweets mentioning “goal”, and create a device that would ring a bell when a spike in that frequency was detected.
Spoiler alert: if you are curious about how I built the bell before hearing the specifics, take a look at this video:
Detecting spikes in Tweet volume
Detecting relevant events in time-series data is not exactly rocket science, and there are plenty of research articles on that topic. But sometimes the implementation of these techniques is too complex to be applied in short period of time. I decided to build a simpler, less-precise solution that would work well enough for my needs. I started with the hypothesis that during any given game, lots of fans would Tweet when a goal was scored.
Thankfully, some simulations I did demonstrated that this pulse can be easily detected. Take a look at this data from the second half of the first World Cup match between Brazil and Croatia:
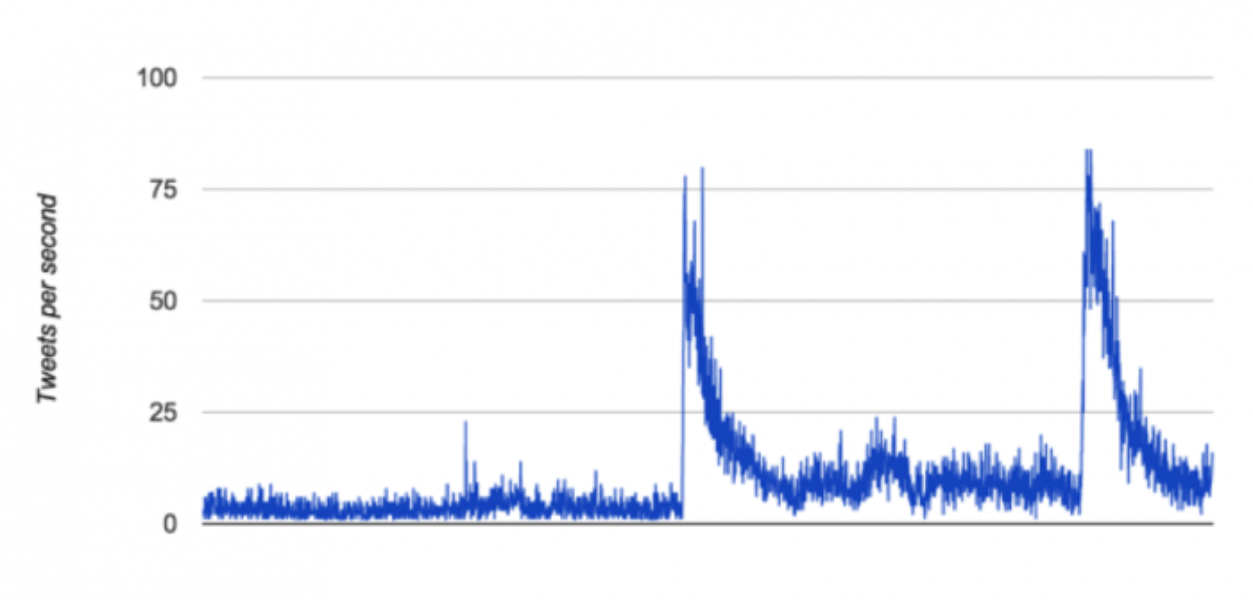 Image 1: Tweets per second mentioning “gol copa, gool copa, goool, golaço” during the match June 12th, 2014.
To get this data, I simply connected to the POST status/filter endpoint of the Streaming API. There I monitored for mentions of the Brazilian Portuguese words for “goal”, “world cup” and their variations, and then calculated their frequency in Tweets per second (TPS). Looking at the resulting graph above it is easy to identify when the goals occured.
The next step was to convert this noisy data into a baseline value that could serve as a trigger for the bell when that threshold was reached. To achieve this, I used a simple statistical tool: exponential moving average (EMA). Rather than showing you all the formulas, let’s instead visualize what EMA does:
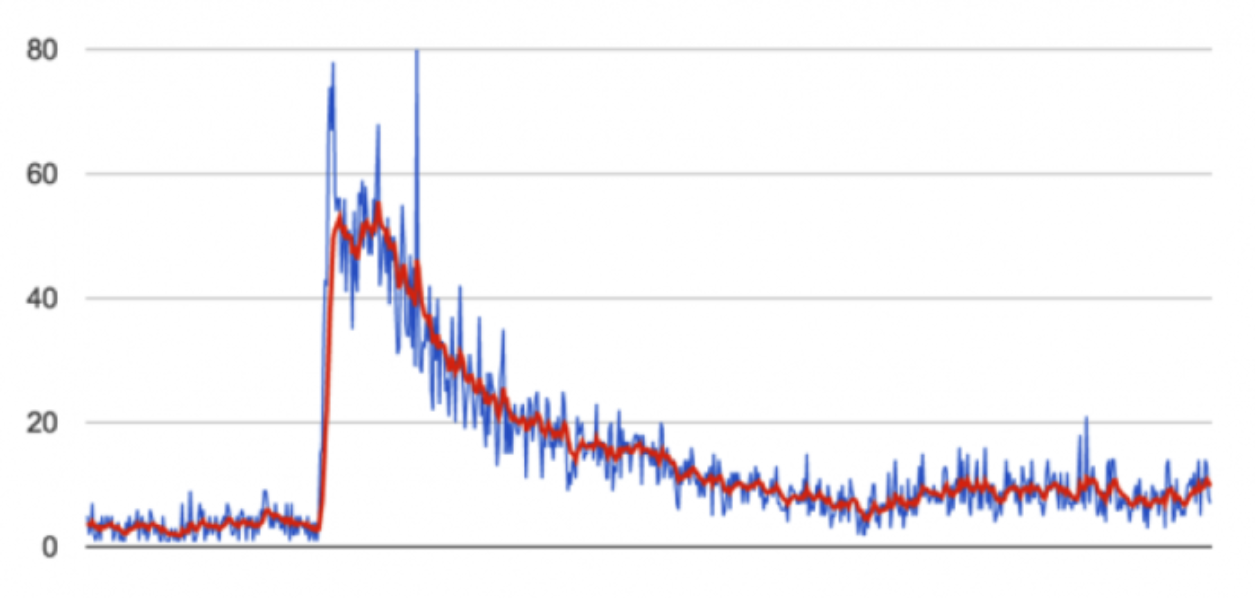 Image 2: EMA calculated based on Tweets per second around the first goal during the second half of Brazil vs. Croatia.
As you can see, EMA smoothed the noisy Tweets-per-second data and gave us a cleaner time-series data set. To detect the goal spike, I then calculated a simple growth value relative to 10 seconds prior: (EMA now - EMA 10 sec ago) / EMA 10 sec ago. Let’s again use a visualization to see how this formula helped to determine the baseline trigger:
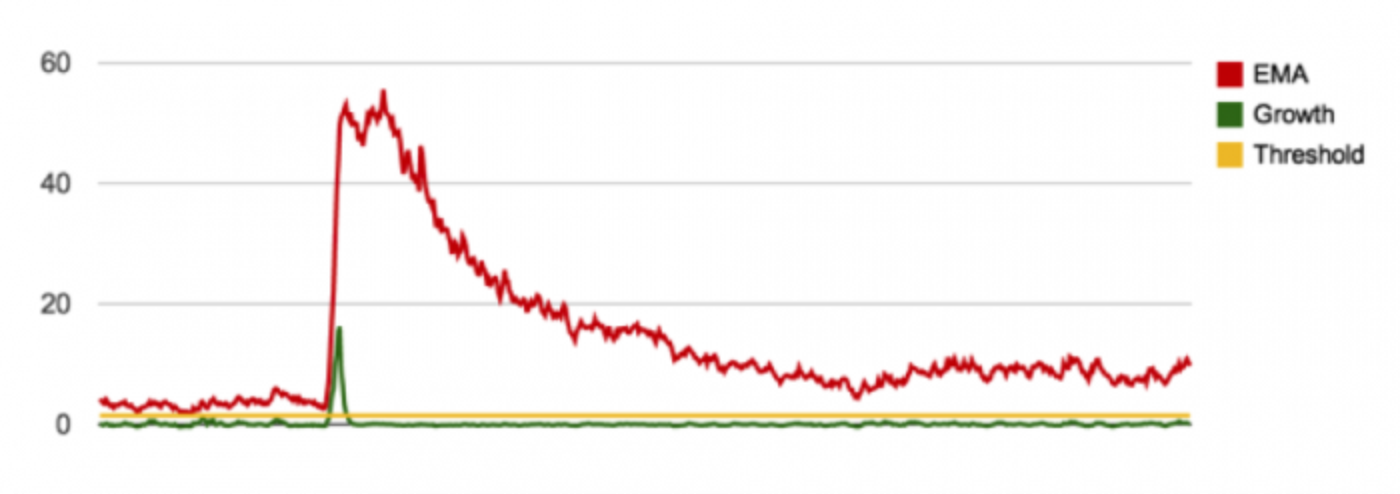 Image 3: Spike detection using relative growth around the first goal during the second half of Brazil vs. Croatia.
When the growth calculation results were greater than 1.5 (which meant that we saw a 150% growth rate in Tweets per second between present and the previous 10 seconds) the algorithm fired the trigger that happily rang the goal bell. Let’s zoom out and see the whole second half, removing the EMA curve:
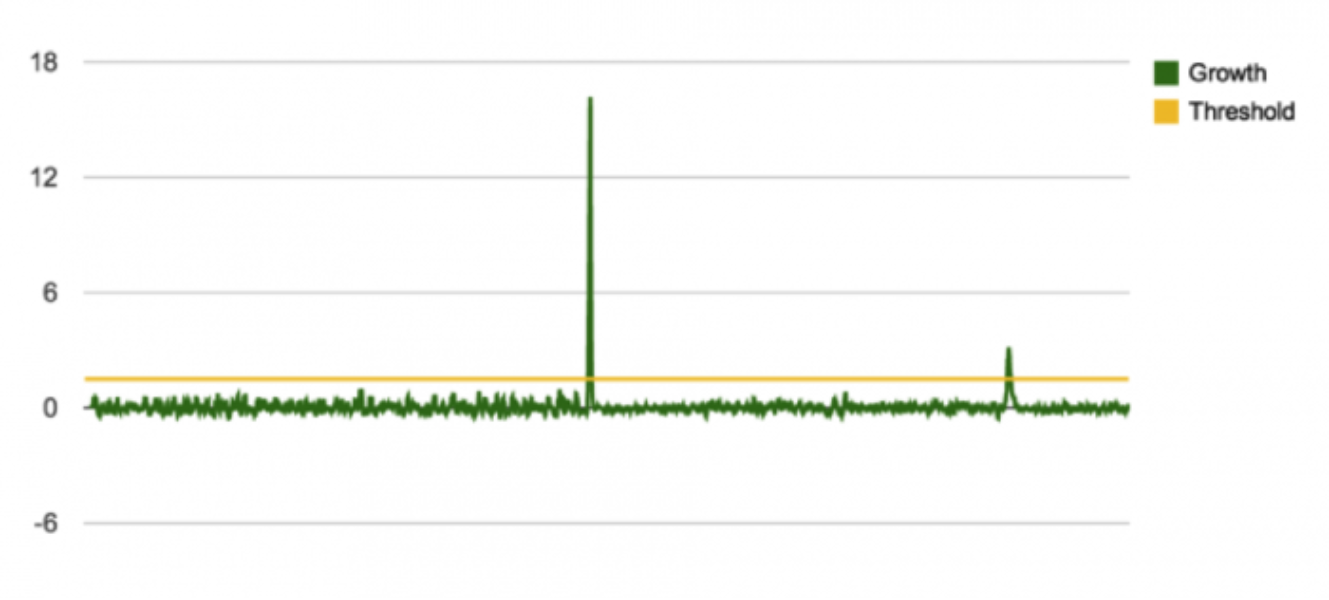 Image 4: Spike detection using relative growth during the second half of Brazil vs. Croatia. Yes, we had two goals scored during this period.
It was interesting to see that the first goal had stronger growth. In my opinion, Twitter users were ready to tweet as soon as the goal was scored (because it was a penalty kick by Neymar), which resulted in more people tweeting over a shorter period of time. As you can also see on the last graph, the way growth was calculated helped to identify only when the Tweets-per-second frequency varied more quickly and in a larger amplitude (i.e., when a very exciting event happened during a game).
There are implementations of these calculations in Python and Ruby if you want to try them out yourself. The code for connecting to the Streaming API is relatively short and simple:
@client = TweetStream::Client.new

@client.on_error do |message|
  puts "ERROR: #{message}"
end
@client.on_enhance_your_calm do
  puts "Calm down"
end
@client.on_limit do |skip_count|
  puts "You lost #{skip_count} tweets"
end

puts "Starting to track: #{@keywords}...\nLanguages: #{@languages}"
@client.filter(:track => @keywords, :language => @languages) do |status|
  @peak_detector.collect_frequency

  @bell.ring! if @peak_detector.is_this_a_peak? || status.text.index(@magic_word)
end
https://github.com/lfcipriani/tilingol/blob/master/tilingol.rb#L40
You can also download the data captured during the game if you want to try plotting it in other ways.
Ringing the bell
Once you have the implemented goal-detection algorithm, your device should then ring the goal bell. I decided to use a Raspberry Pi for this. This was the first time I played with it, and I found its potential to be amazing. I built the bell using materials I had at home and borrowed some other items from friends. Here’s the parts list with a brief explanation on how each piece was used:
- Raspberry Pi rev 2: The computer unit that ran the Streaming API connection, detected the spikes and controlled ringing of the bell;
- Servo motor: A tiny motor that allowed precise control of position, velocity and acceleration. It was used to shake the bells;
- Jumper wires: These were used to connect the Raspberry Pi and the servo motor;
- Christmas jingle bells: An appropriately exciting sound for goal notifications;
- Plastic coffee mixer: This was used to increase the movement amplitude of the servo motor;
- Paper clips: These held the bells;
- Lego blocks: These were used to build the structure that held the motor and the Raspberry Pi… not to mention making the project look cool and nerdy.
Here’s a graphic representation of the connections, all fairly simple:
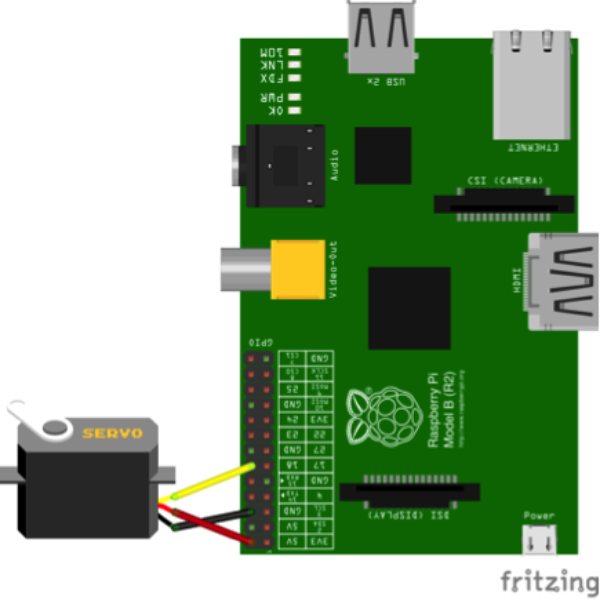 Image 5: Schematic of the hardware project. Use at your own risk!
The code that activates the pin and does the shaking is below:
import RPi.GPIO as GPIO
import time
import sys

class JingleBells:

    def __init__(self, pin):
        self.pin = pin
        GPIO.setmode(GPIO.BCM)
        GPIO.setup(self.pin, GPIO.OUT)

    def shake(self, iterations, speed):
        self.pwm = GPIO.PWM(self.pin, 100)
        self.pwm.start(19)
        time.sleep(speed)
        for n in range(iterations):
            self.pwm.ChangeDutyCycle(16)
            time.sleep(speed)
            self.pwm.ChangeDutyCycle(19)
            time.sleep(speed)
        self.pwm.stop()

    #def __del__(self):
    #    GPIO.cleanup()

if __name__ == '__main__':
    jb = JingleBells(18)
    jb.shake(int(sys.argv[1]), float(sys.argv[2]))
    GPIO.cleanup()
    exit()
https://github.com/lfcipriani/tilingol/blob/master/jinglebells.py
You just need to execute the Python file and decide how many times the bell will shake (iterations parameter) and at what speed. Then we just call this program from the goal detection algorithm we previously implemented. The only important thing is to call it asynchronously, because we don’t want to enqueue the flow of Tweets coming through the Streaming connection (see https://github.com/lfcipriani/tilingol/blob/master/jingle_bell.rb).
It’s out of scope of this article to explain what PWM is and how to use GPIO library, but know that there are many good resources about that on Raspberry Pi’s website.
Wrapping up
I just showed you how easily you can detect goals using the volume of Tweets coming from the Streaming API. After identifying these goals, you can decide the best way to notify someone that it happened… but I must say, using a Raspberry Pi is a really fun way to do it. When talking about the Twitter platform, we always say that the API is a great way to connect to the pulse of the planet and here we’ve proven that it can be tapped and interpreted in fun, interesting ways!
All the code built to make this happen is available at GitHub. Also I want to thank @luisleao for helping with the hardware part during the hackathon.
One more thing
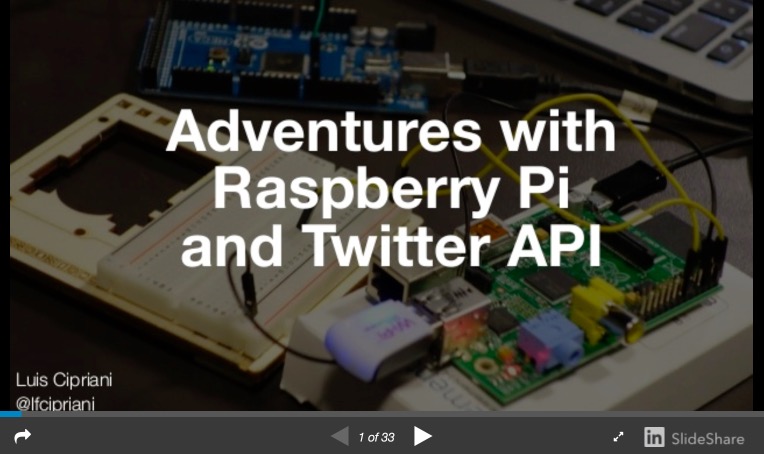
This blog post was later turned into a tech talk where I detailed a bit more the hardware part and some challenges I faced when building this project. The slides are embedded below: